SaaS Dashboard Design: 9 Principles That Make Complex Data Simple
A dashboard isn’t a wall of charts. Here are the principles I use to design SaaS dashboards people open every morning.
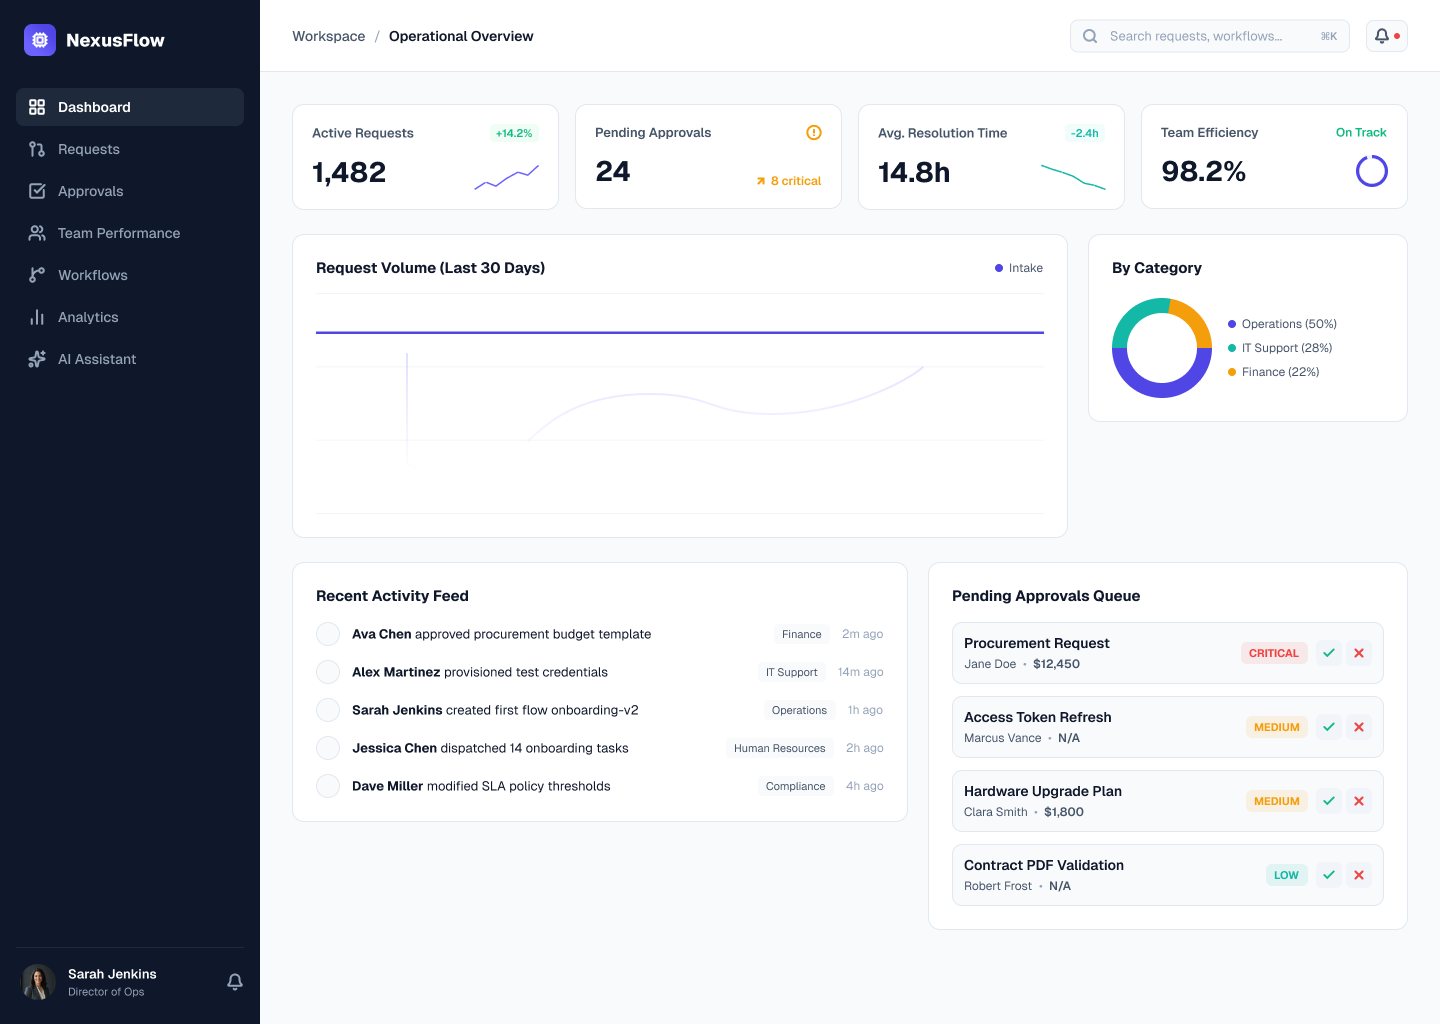
A great SaaS dashboard answers one question quickly: “What needs my attention right now?” A weak one shows everything at once and leaves users to work it out. When I design dashboards and admin panels, I follow a small set of principles that make complex products feel simple.
1. Start with the job, not the data
Before drawing a single chart, list the three decisions your users make every day. A support lead wants to know which tickets are overdue; a finance manager wants to know if spend is on track. Design the dashboard around those decisions and push everything else one click deeper.
A simple exercise I run with teams: write each user role on a sticky note, then list the questions that role asks the product every morning. Those questions become the widgets on the dashboard. Anything that doesn’t answer a question belongs in a report, not on the home screen.
2. Build a clear visual hierarchy
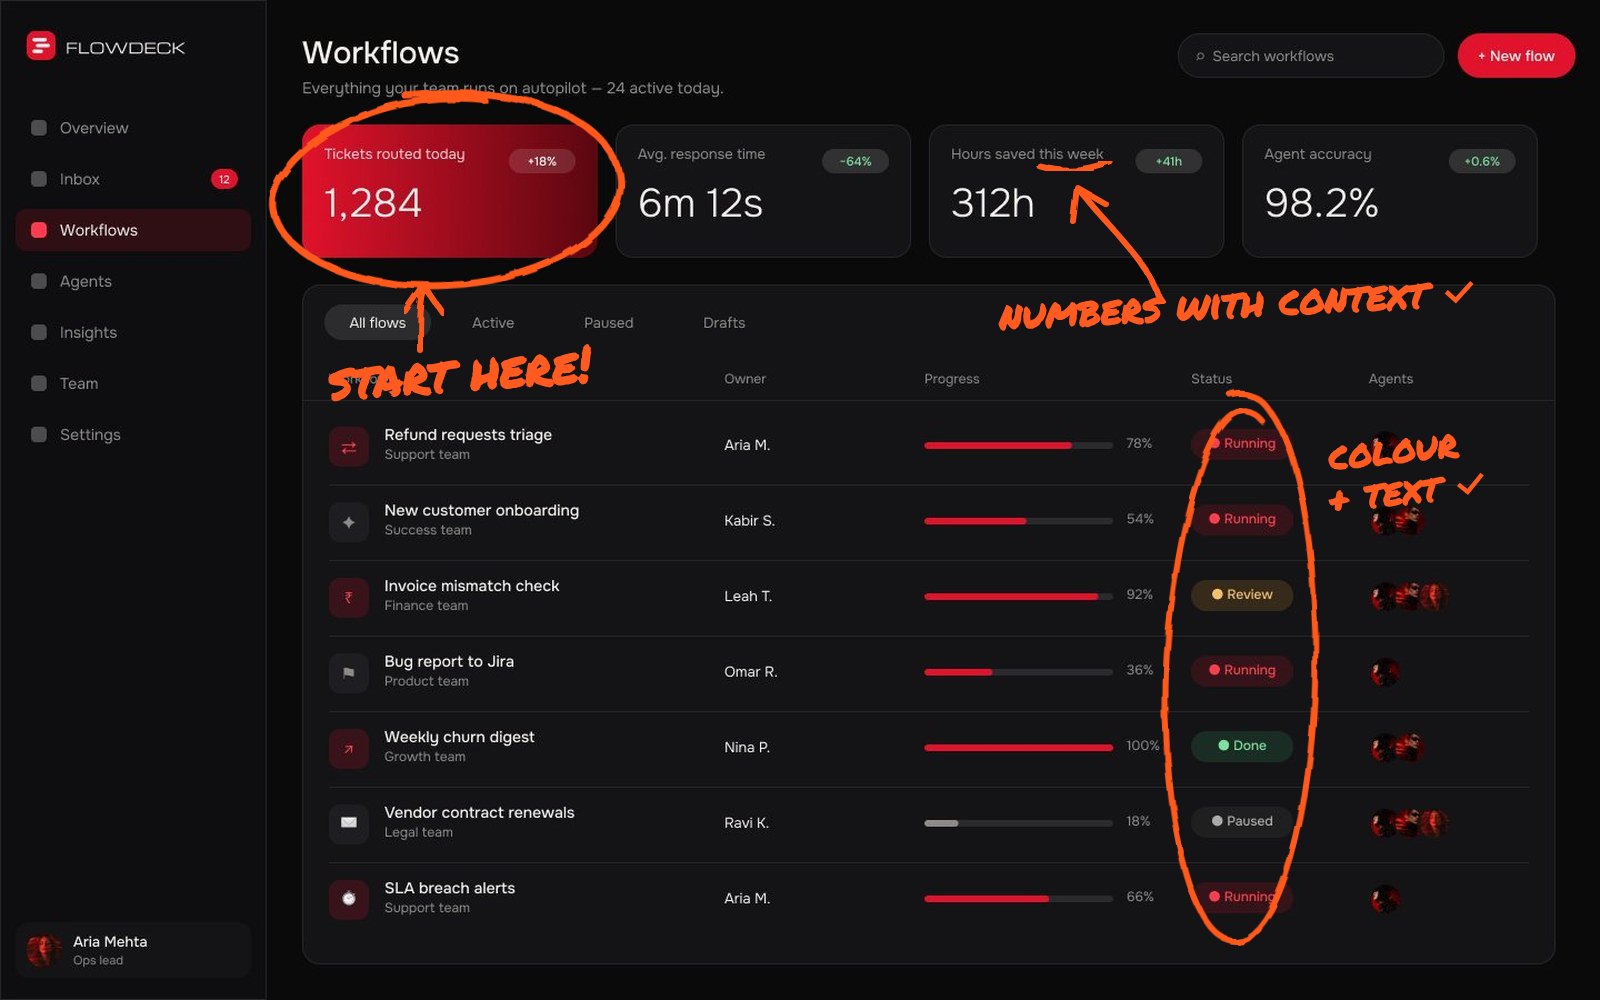
Put the most important numbers top left, where eyes land first. Use size, weight and colour to show priority, and keep the number of “loud” elements on screen small. If everything is bold, nothing is.
3. Make numbers meaningful
A number alone tells users little. Pair key metrics with context: change versus last period, a target or a small trend line. “142 open requests, up 12% this week” is something people can act on.
4. Choose the simplest chart that works
Line charts for trends, bar charts for comparisons and plain numbers for single values. Avoid 3D charts, pie charts with many slices and decorative visuals that make reading slower.
5. Design tables for scanning
Most SaaS work happens in tables. Align numbers right, keep row height comfortable, freeze the first column on wide tables and let users sort, filter and bulk-select without leaving the page.
- Right-align numbers so digits line up
- Use status pills with text, not colour alone
- Show row actions on hover, with a visible menu on mobile
- Keep column headers sticky on long tables
- Offer saved views for the filters people use every day
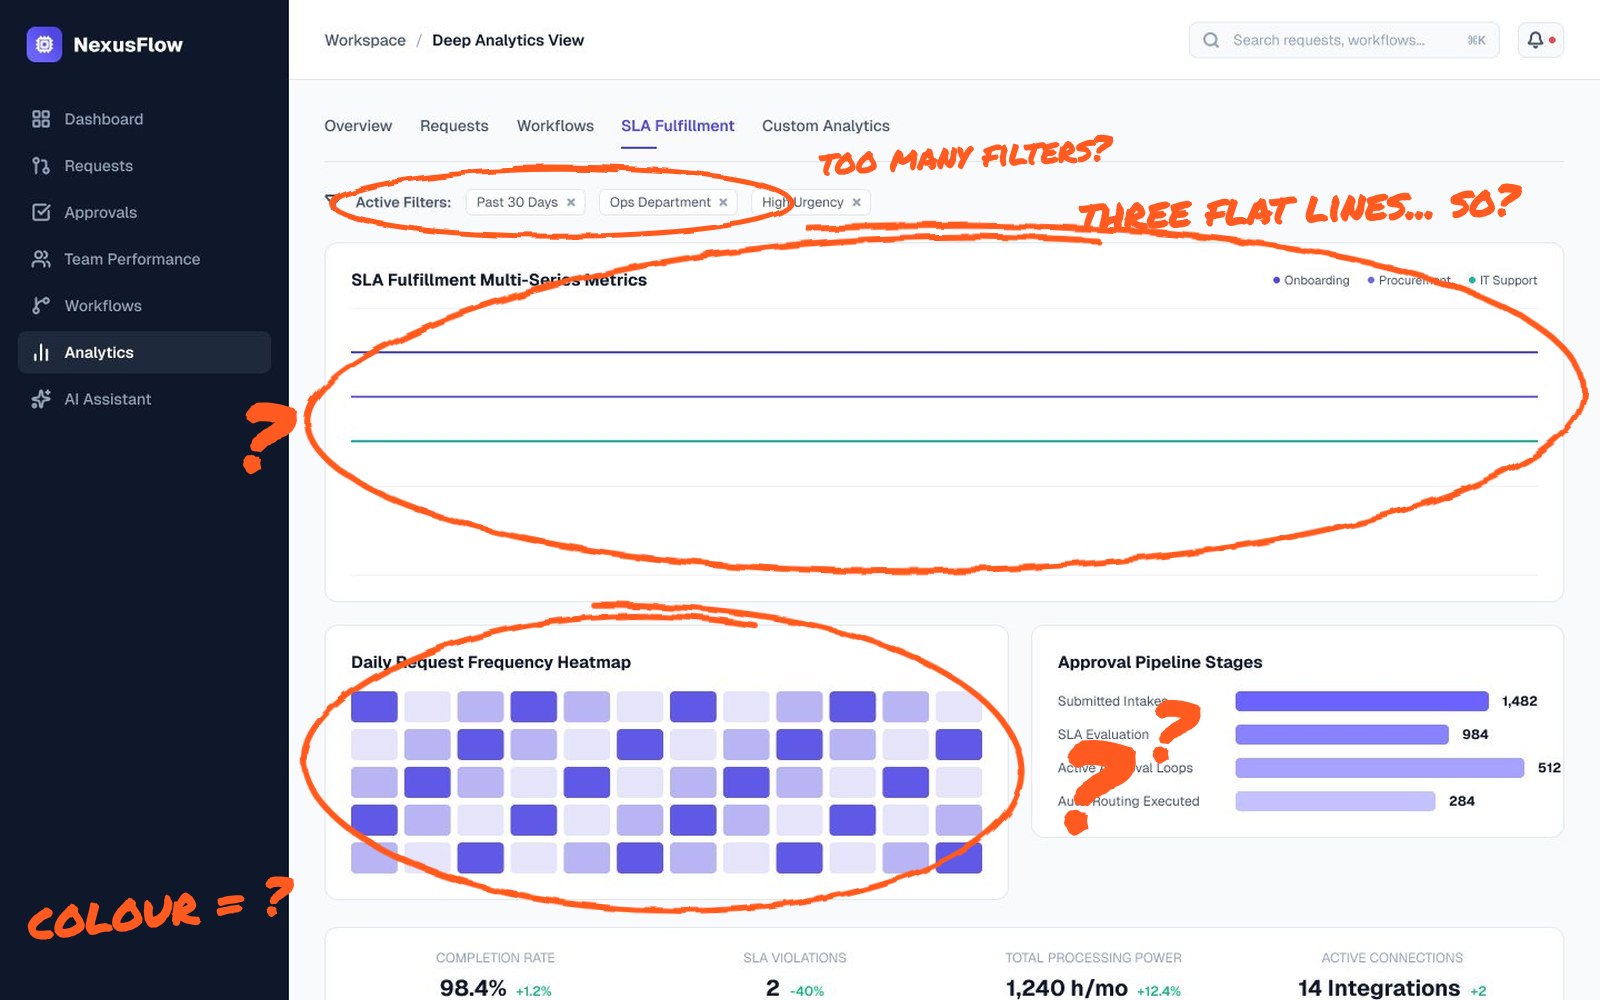
6. Filters should be visible and forgiving
Show active filters as chips users can remove in one click, remember their last filter and always offer a quick way back to “everything”.
7. Design empty, loading and error states
New accounts see an empty dashboard first, so that state is your onboarding. Show what will appear, why it matters and one action to get started. Skeleton loaders and clear error messages build trust when things are slow or fail.
Error messages deserve the same care. “Something went wrong” leaves users stuck. Say what happened, whether their data is safe and what to do next, such as retrying or contacting support with a reference number.
8. Keep navigation boring
Users should never wonder where they are. A consistent sidebar, clear page titles and breadcrumbs for deep pages do more for usability than any clever animation. Nielsen Norman Group’s 10 usability heuristics are still the best checklist for this.
9. Build it on a design system
Dashboards grow fast. A shared set of components, spacing rules and colour tokens keeps new features consistent and saves developers time. I cover this in Figma design systems for startups.
Dark mode, permissions and responsive layouts are much easier when they are baked into components from the start rather than patched in later. A system turns “can we add this?” from a redesign into a configuration.
A quick dashboard review you can run today
Open your dashboard and squint at it. The elements you can still make out are the ones users notice first. If those aren’t the most important numbers or actions, your hierarchy needs work.
- Can a new user explain what each widget means?
- Does every number have context, like a trend or target?
- Is there one obvious next action on the screen?
- Do empty and loading states look intentional?
- Does it still work on a laptop screen, not just a large monitor?
If you answer “no” to two or more, a focused dashboard redesign will likely make a visible difference to how often people use the product.
Putting it together
Good dashboard design is mostly editing: deciding what not to show. If your product has grown into a maze of screens, a focused redesign of the dashboard and core flows can change how people feel about the whole product. See the full process in my Nexus case study, or tell me about your product.
Send me your screens and I’ll show you where users drop off and what to fix first.
Quick answers
What makes a good SaaS dashboard?
A good SaaS dashboard shows users what needs attention first, gives numbers context, uses simple charts and makes filtering and drilling down easy.
How many metrics should a dashboard show?
As few as possible. Lead with the handful of metrics tied to daily decisions and move secondary data to detail pages or reports.